The Project
This project provides a comprehensive dashboard for analyzing data from the TFT (Teamfight Tactics) Challenger League (the top ranked players) using Riot Games’ Developer API. The dashboard is built using Streamlit and includes various visualizations and metrics to help users gain insights into the top players, units, traits, and items used in the Challenger League.
Data Collection
Setting up the Database
In order to collect the necessary data from the API, I first wanted to set up a PostgreSQL database on a local server to house all of the data since the API limits how far back you can call the data. While I likely won’t get too much into database design here, I’ll say I created 5 separate tables to house the data:
challenger_league: all player info and win-loss data for players in the challenger leaguematches: all match dataparticipants: all participants data frommatchestraits: all traits data fromparticipantsunits: all unit data fromparticipants
Data Pipeline
A few scripts are essential for feeding accurate data into the database:
challenger_search.pycontains 2 key functions:get_challenger_league_puuid(): finds all thepuuidsfor Challenger League players- a
puuidis a player id necessary to link players to their in-game stats
- a
get_challenger_league_data(): finds all player info and win-loss data for challenger league players
challenger_league.py: useschallenger_search.pyto send data to the local databasetftpal.py: inserts all challenger match data to local database
Data Processing
Now that the is stored properly, it needs to be retrieved from the database and processed before we can visualize it.
Retrieving the Data with SQLAlchemy
from sqlalchemy import create_engine

# Database connection parameters
db_params = config()

# Create SQLAlchemy engine
engine = create_engine(f"postgresql://{db_params['user']}:{db_params['password']}@{db_params['host']}:{db_params['port']}/{db_params['database']}")

# Function to get data from PostgreSQL and load into a pandas DataFrame
def get_data_from_db(query):
    try:
        # Execute the query and load data into a DataFrame
        df = pd.read_sql_query(query, engine)
        return df
    except Exception as e:
        st.error(f"Error: {e}")
        return pd.DataFrame()

units_query = '''
    select
        u.character_id,u.puuid,u.tier,
        u.match_id,u.itemnames,u.unit_index,
        m.game_datetime
    from units u
    join matches m on m.match_id=u.match_id
    where m.tft_set_number=13;
'''

traits_query = '''
    select
        t.puuid, t.trait_name, t.tier_current,
        t.tier_total, t.match_id, t.num_units,
        m.game_datetime
    from traits t
    join matches m on m.match_id=t.match_id
    where m.tft_set_number=13;
'''

challenger_query = '''
    select
        cl.puuid, p.riotidgamename, cl.leaguepoints,
        cl.rank, cl.wins, cl.losses,
        cl.veteran, cl.inactive, cl.freshblood,
        cl.hotstreak, cl.date
    from challenger_league cl
    join participants p on cl.puuid=p.puuid;
'''

# Get data from the database
units_data = get_data_from_db(units_query)
traits_data = get_data_from_db(traits_query)
challenger_data = get_data_from_db(challenger_query)
Cleaning the data
# Remove the 'TFT13_' prefix and capitalize the first letter of each character_id entry
units_data['character_id'] = units_data['character_id'].str.replace('TFT13_', '').str.capitalize()
units_data['character_id'] = units_data['character_id'].str.replace('Tft13_', '').str.capitalize()

traits_data['trait_name'] = traits_data['trait_name'].str.replace('TFT13_', '').str.capitalize()

# Ensure the 'date' column is in datetime format
challenger_data['date'] = pd.to_datetime(challenger_data['date'])

# Drop duplicates based on puuid and date
challenger_data = challenger_data.drop_duplicates(subset=['puuid', 'date'])

# Select the most recent date for each riotidgamename
most_recent_data = challenger_data.loc[challenger_data.groupby('riotidgamename')['date'].idxmax()]

# Create leaderboard for top 10 riotidgamenames by leaguepoints
leaderboard_data = most_recent_data.sort_values(by='leaguepoints', ascending=False).head(10)
leaderboard_data = leaderboard_data[['puuid', 'date', 'riotidgamename', 'leaguepoints', 'wins', 'losses']]

# Convert the 'date' column to a string format that includes only the date part
leaderboard_data['date'] = leaderboard_data['date'].dt.strftime('%Y-%m-%d')

# Calculate win percentage and format it
leaderboard_data['win_pct'] = (leaderboard_data['wins'] / (leaderboard_data['wins'] + leaderboard_data['losses'])) * 100
leaderboard_data['win_pct'] = leaderboard_data['win_pct'].round(1).astype(str) + '%'

leaderboard_data_display = leaderboard_data[['date', 'riotidgamename', 'leaguepoints', 'wins', 'losses']]

# Filter options for game date
min_date = min(units_data['game_datetime'].min(), traits_data['game_datetime'].min())
max_date = max(units_data['game_datetime'].max(), traits_data['game_datetime'].max())
selected_date_range = st.date_input('Select Game Date Range', [min_date, max_date])

# Filter data based on selected game date range
filtered_units_data = units_data[
    (units_data['game_datetime'] >= pd.to_datetime(selected_date_range[0])) &
    (units_data['game_datetime'] <= pd.to_datetime(selected_date_range[1]))
]

filtered_traits_data = traits_data[
    (traits_data['game_datetime'] >= pd.to_datetime(selected_date_range[0])) &
    (traits_data['game_datetime'] <= pd.to_datetime(selected_date_range[1]))
]

# Create a dropdown selection for the riotidgamename
selected_player = st.selectbox('Select Player', ['All'] + leaderboard_data['riotidgamename'].tolist())

# Filter the data based on the selected player
if selected_player != 'All':
    selected_puuid = leaderboard_data[leaderboard_data['riotidgamename'] == selected_player]['puuid'].values[0]
    filtered_units_data = filtered_units_data[filtered_units_data['puuid'] == selected_puuid]
    filtered_traits_data = filtered_traits_data[filtered_traits_data['puuid'] == selected_puuid]

# Count the occurrences of each character_id and tier
character_tier_counts = filtered_units_data.groupby(['character_id', 'tier']).size().reset_index(name='count')

# Aggregate the counts by character_id to get the total counts
total_counts = character_tier_counts.groupby('character_id')['count'].sum().reset_index(name='total_count')

# Merge the aggregated counts back with the original character_tier_counts DataFrame
character_tier_counts = character_tier_counts.merge(total_counts, on='character_id')

# Sort the character_tier_counts DataFrame by total_count in descending order and then by tier in ascending order
character_tier_counts = character_tier_counts.sort_values(by=['total_count', 'tier'], ascending=[False, True])

# Count the occurrences of each trait_name
trait_counts = filtered_traits_data['trait_name'].value_counts().reset_index()
trait_counts.columns = ['trait_name', 'count']

# Clean Trait names
trait_counts['trait_name'] = trait_counts['trait_name'].replace('Warband', 'Conqueror')
trait_counts['trait_name'] = trait_counts['trait_name'].replace('Cabal', 'Black Rose')
Data Visualization and Analysis
Now that the data has been processed, we can visual and explore. All code for these visualizations are in challenger_dashboard.py
Interaction with Plotly
Plotly is one of my favorite visualization libraries because of how many useful out of the box features it has. It allows the user to interact with the graphs in a variety of different ways and explore the data all on their own.
Top 10 Players
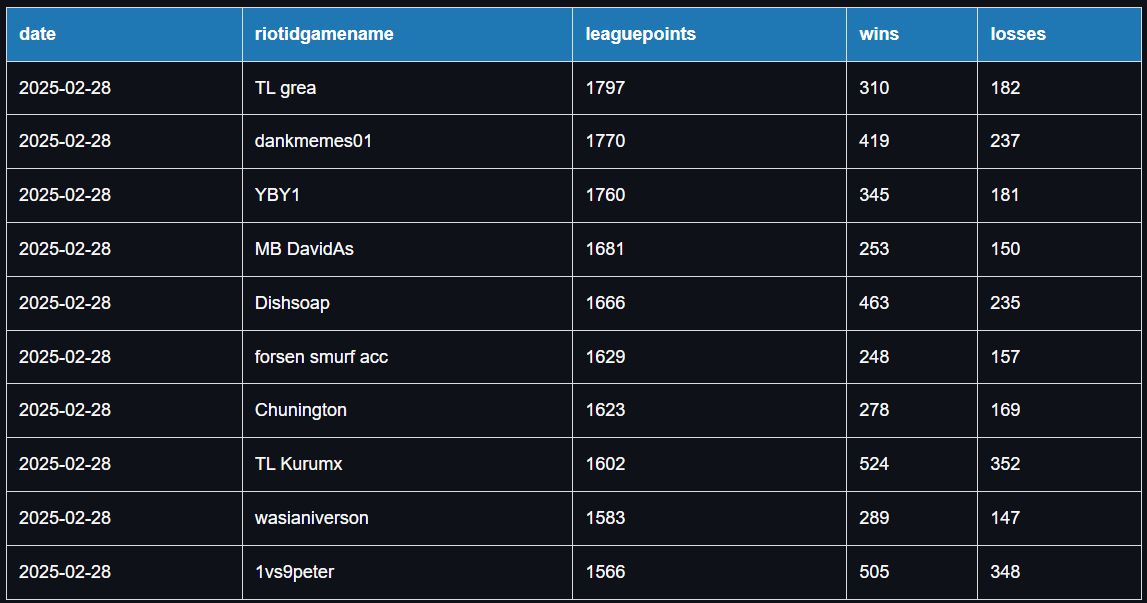
Here I display the top 10 players by League Points with their wins and losses.
Most Used Units and Traits
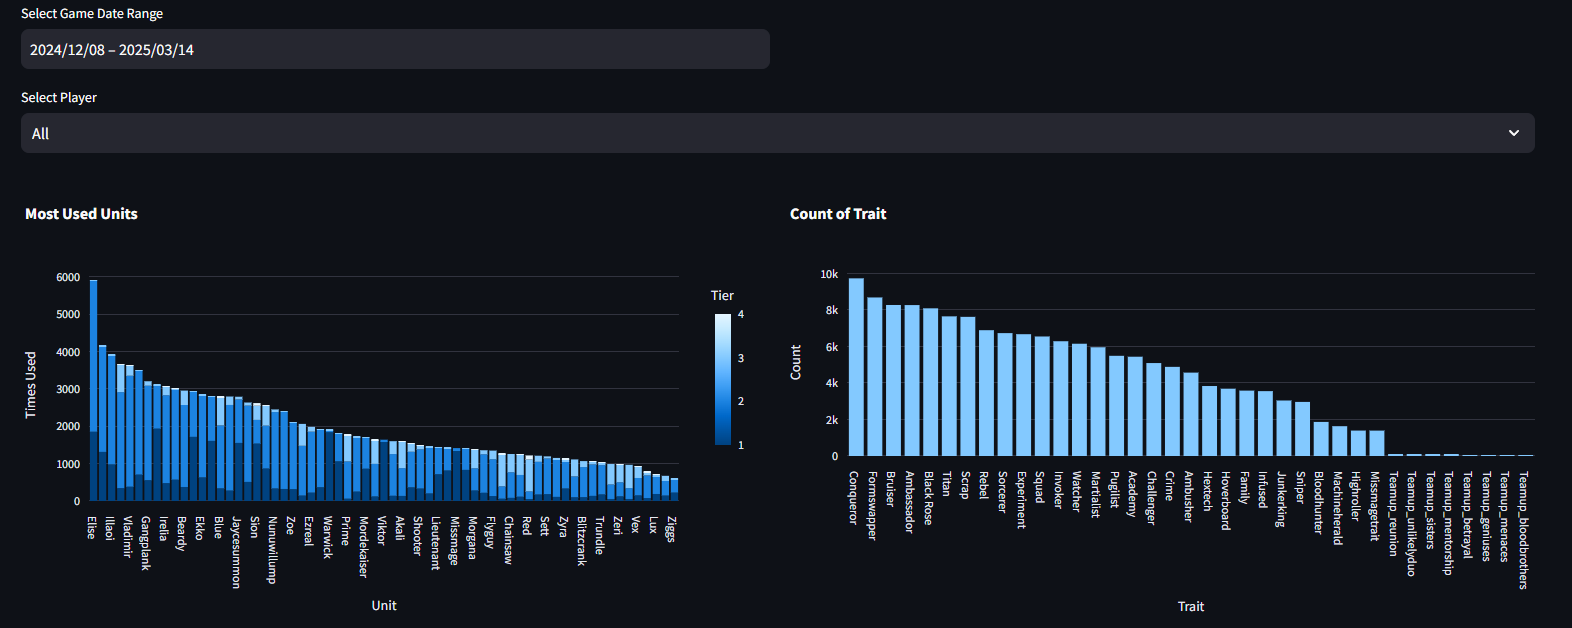
Next, the user can select the date range they want to view. They can also select All to view all players’ data from the Challenger League or one of the Top 10 Challenger players.
These views show that Elise is by far the most selected Unit while Conqueror is the most selected Trait.
Most Used Items and Team Composition Per Unit
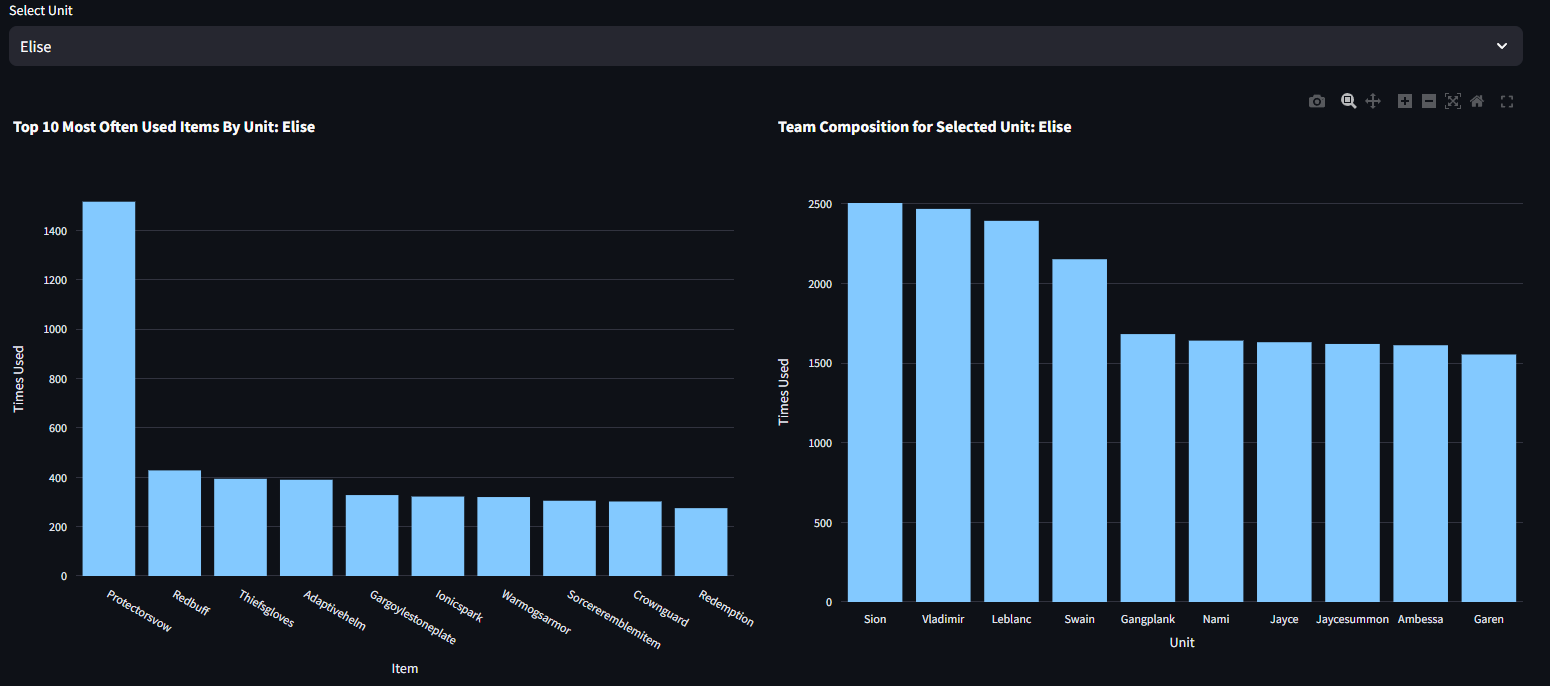
The following charts show the most selected Items and Teammates for a specific Unit. In the pictured example, we see that Elise is most often equipped with the Protector’s Vow and most often paired with her other Black Rose teammates such as Sion (Trait Bonus Character), Vladimir**, Leblanc, and Swain.
What’s Next?
- Now that Set 13 is ending on April 1st 2025, this information won’t be relevant after that but the structures in place can rollover directly to do the same analysis for Set 14.
- Host the PostgreSQL database online so I can deploy the dashboard online to Streamlit.
- Apply for upgraded developer license from Riot games for increased permissions and persistent API key.
- Improved data cleaning. While the data is accurate and I’ve done some good cleaning to make it more readable, there are still some legacy terms that could be updated and I could make the Item text more readable by separating them into multiple words.